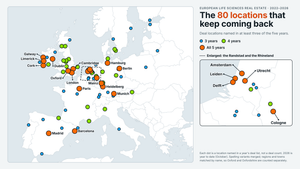

The Five-Year Club takes almost half of Europe's life sciences real estate deals. The other half is spread across some 460 places in 28 countries, and our database covers them all.
Three numbers sum up Europe’s life sciences real estate market: 20, 80 and 480.
In Staying power, we started at the core. Of the c. 480 European locations in our deals database since 2022, just 80 recorded deals in at least three of the five years, and these persistent 80 account for about seven in ten deals. Twenty went further, with deals in every year. This Five-Year Club takes almost half of all deals on its own. Not every hotspot is a lab then showed how different those 20 are from one another.
This time we zoom out one step at a time, from the 20 to the 80 and then to the whole map. Each step adds more places, each with fewer deals.
20 places, half the deals
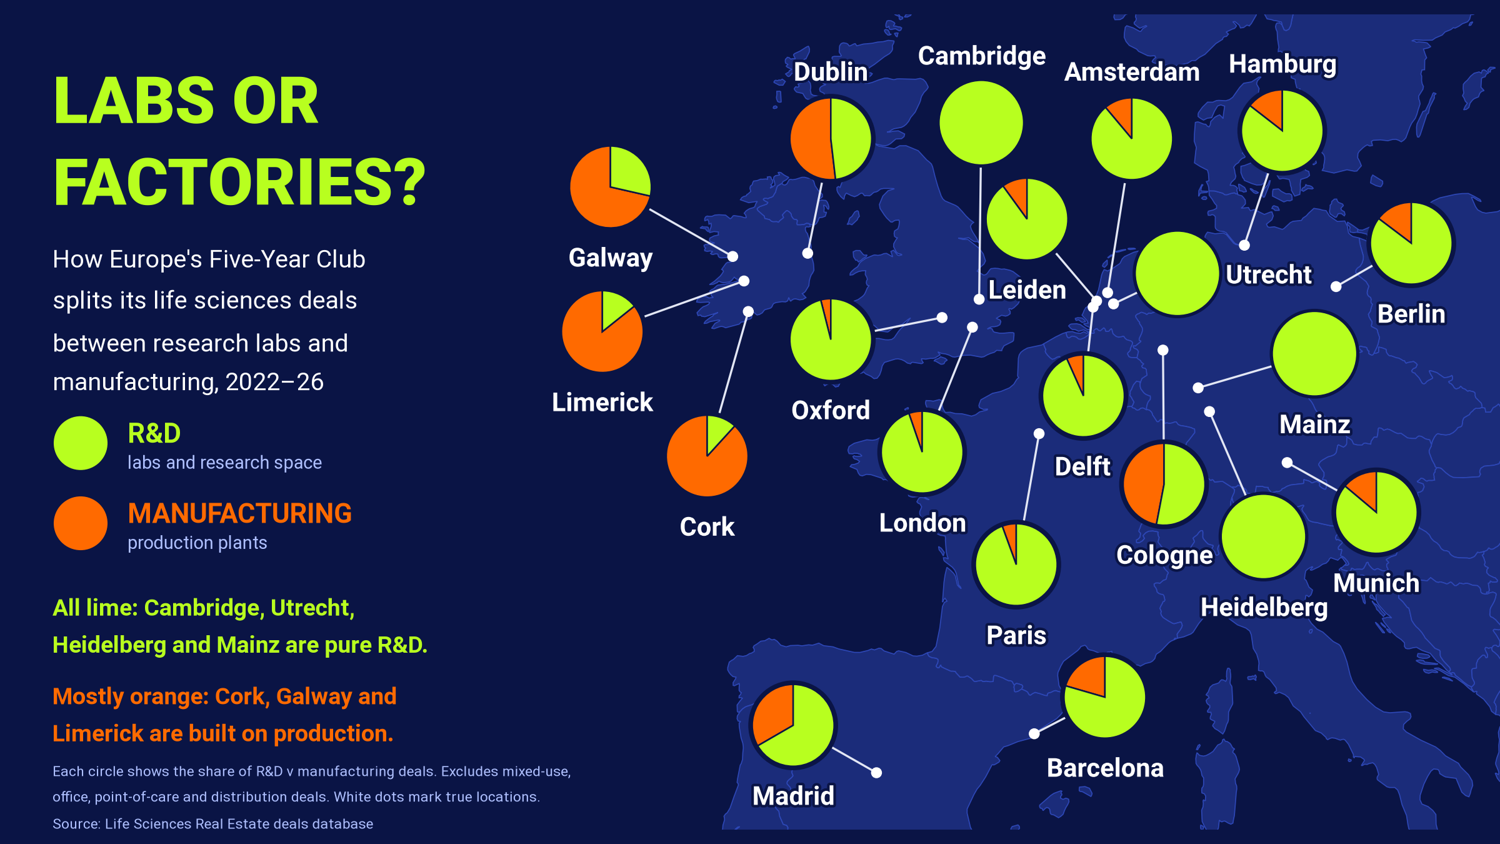
When Stephen Ryan presented our data to the Urban Land Institute in Dublin on 4 November, one chart (shown below) drew a lot of attention and interest. It compares R&D and manufacturing deals in each Five-Year Club city. Cambridge, Utrecht, Heidelberg and Mainz are pure R&D. Cork, Galway and Limerick are built on production, while Dublin and Cologne are split almost evenly.
80 places, seven in ten deals
Another 60 locations have deals in three or four of the five years. They take the persistent 80 from almost half of all deals to about seven in ten. Germany and the UK account for almost half of the 80, followed by the Netherlands, Ireland, France and Spain.
480 places, 28 countries
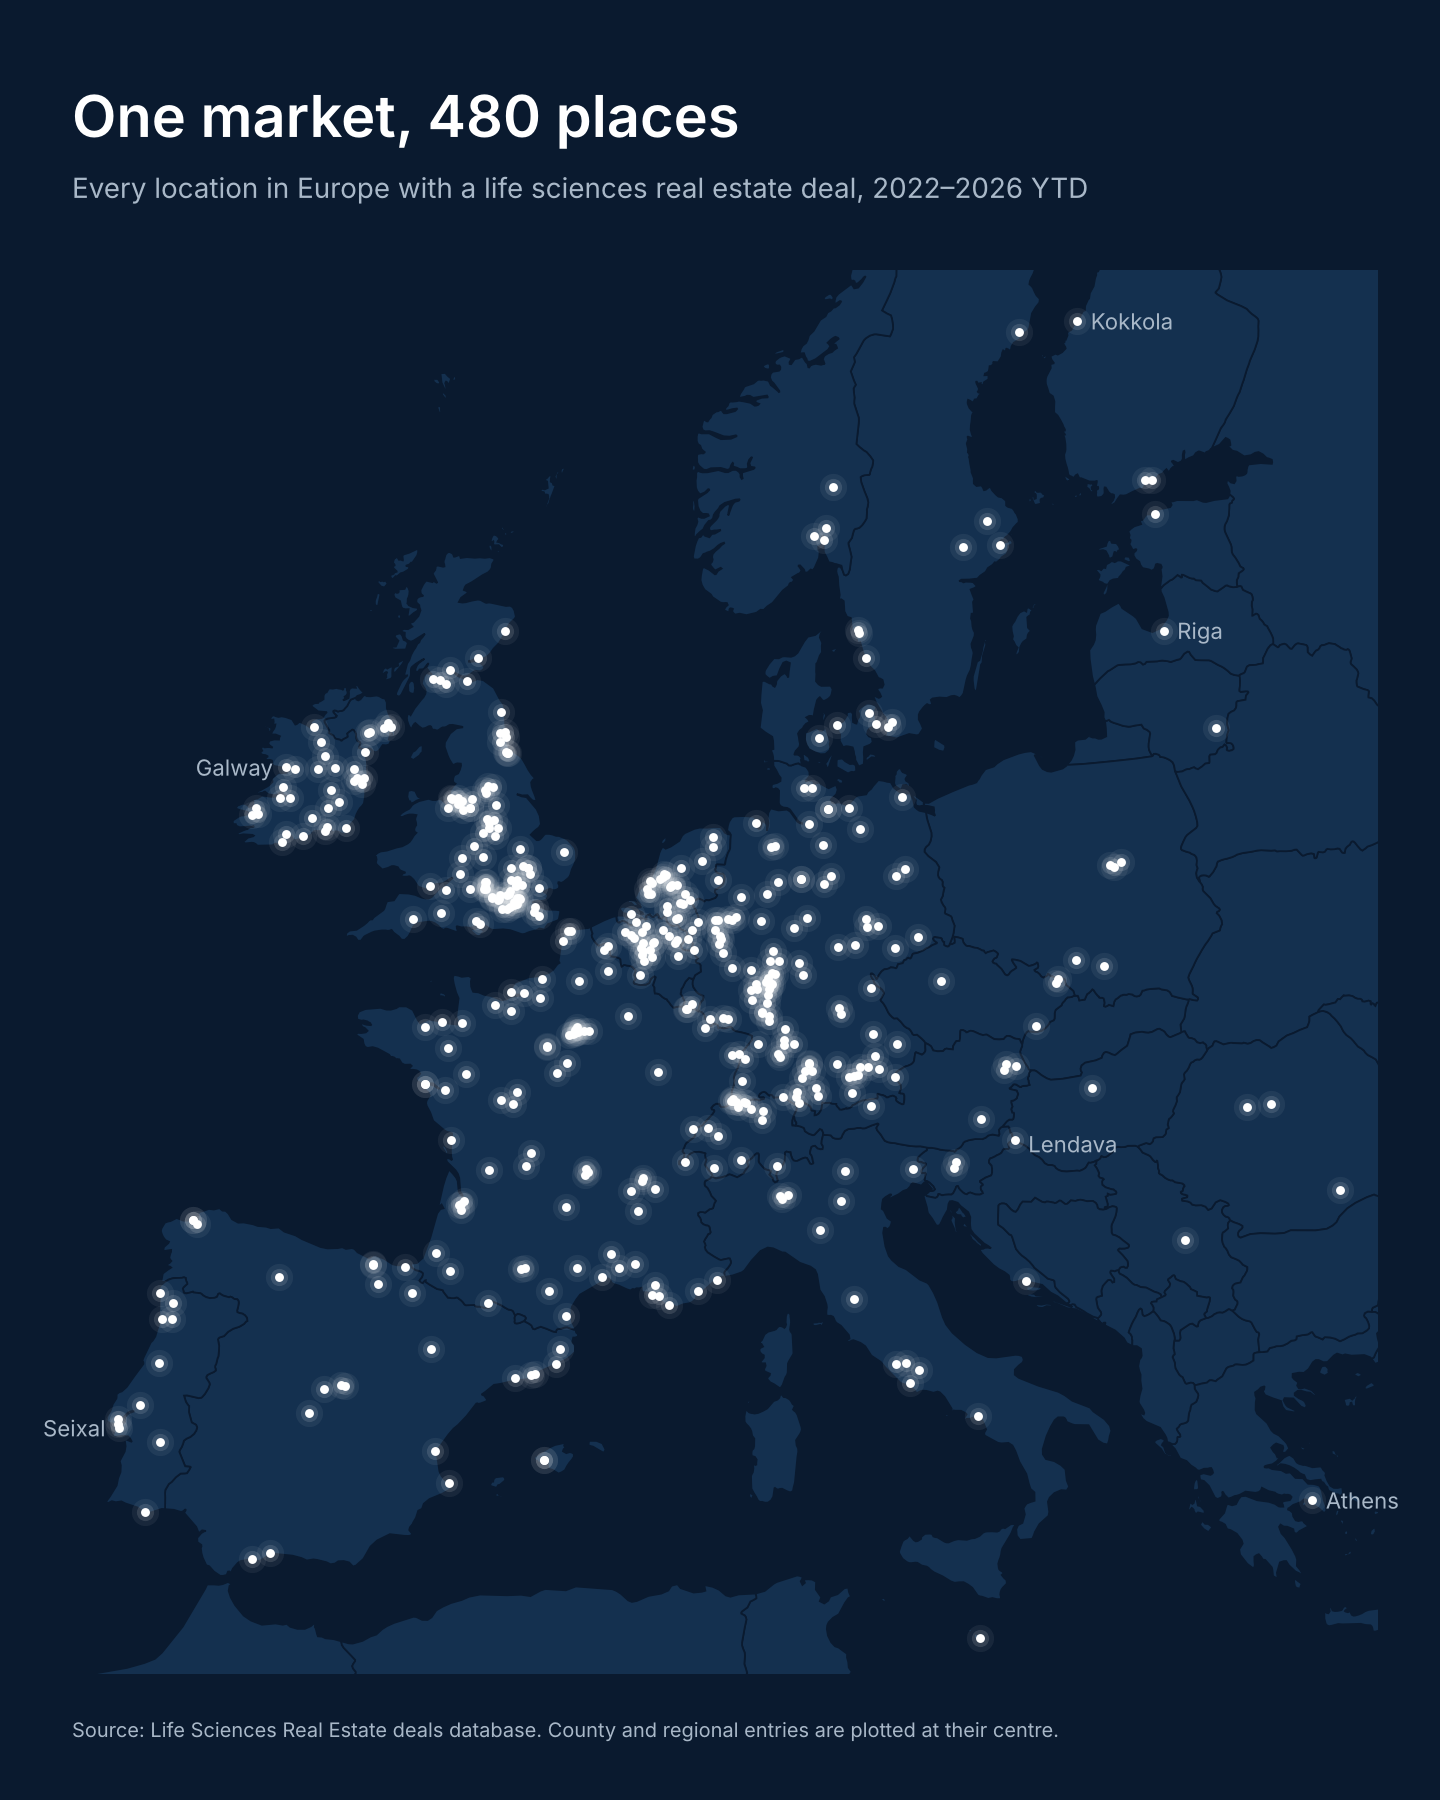
The remaining 400 locations have deals in just one or two years, and between them account for about three in ten deals. The map above shows every location with a deal since January 2022. It runs from Kokkola in Finland to Athens, and from Galway to Riga, with places such as Seixal in Portugal and Lendava in Slovenia in between. Places with only an occasional deal are easy to miss, but they can be where the next tenant, buyer or partner appears.
Broad, varied, and easy to search
Coverage is only useful if you can find what you need. Our database holds more than 2,000 deals in 28 countries, and the available data is broken down over 12 fields. These include the deal type (lease, sale, new build, conversion or finance), the building type (from labs to production plants, warehouses, clinics and mixed-use buildings), the dealmaker, and size and value where these are disclosed.
Every deal can be filtered, searched and sorted in seconds, by location, building type, deal type or dealmaker. You can follow a single town or compare whole countries. You can sort by time (e.g. just deals in Q3 2026), size of building (in sq m) or length of lease in years if it's a lease deal.
Is your market on the map? Tell us which places you are watching and we will show you what the database holds for them in a short demo. Find out more about the deals database.
Note: portfolio deals spanning several locations are excluded from the map above.